Using the Dashboard
When you log in to the .tms webUI using your default browser, the Dashboard is the first page that displays.

The Dashboard provides a visual summary of all the activities associated with your deliveries and consignments.
The status of the consignments that you manage is represented by the coloured circles at the top of the Dashboard. The total number of each consignment status is displayed in the coloured circles. The totals update in real time. Each circle is directly linked to the associated report for the status so that you can get detailed information.
Clicking the Pending Deliveries status circle displays the Consignment Notes - Undelivered report.
The black flags with the vehicle ID on the Dashboard map represent the approximate location of each vehicle whose driver has currently logged in to the depot.
Click a black flag on the map to display a popup with the following information:
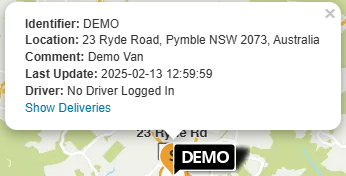
- vehicle identifier
- location of the vehicle (where the GPS signal for the device is pinging)
- vehicle description
- when the driver of the vehicle last logged in or made an update
- the name of the driver.
Click Show Deliveries on the popup, to display the Consignment Notes - On Board Vehicle report for the specific vehicle. This will give you information about the remaining deliveries this driver has to make.
Each depot vehicle and their dispatched route displays in different colours on the Dashboard map so that they are easily distinguished. The colour-coded route also displays all the stops the driver needs to make a delivery to.
Click any stop on the run for a vehicle, to display a popup of information which includes:
-
the consignment
-
the delivery address
-
estimated time of arrival
-
duration
-
status of the delivery.
Click .tms in the top left hand corner on any page to go directly to the Dashboard. You can also click Dashboard on the top navigation bar.