Working with Data Tables in the User Interface
There are various options available for you to customise how information is displayed in data tables on a page within the .wms webUI. All data tables in the .wms webUI have the following customisable options:

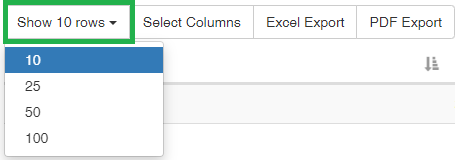
By default, only 10 rows of data are displayed in a data table on a page. You can choose to display more rows.
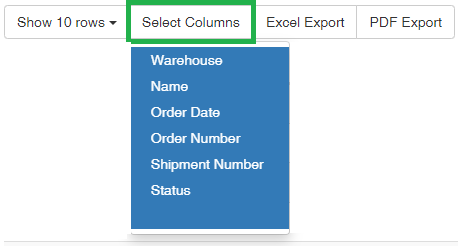
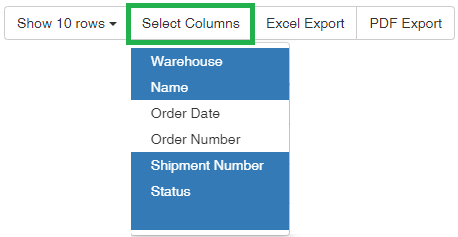
By default, all columns for a specific data table are displayed. You can choose to not display some of the columns. The column options depend on the data being displayed.
The information contained in data tables can be exported to the following formats:
-
Click Excel Export to export the information in a data table to a Microsoft Excel file.

- View and/or download the file.
-
Click PDF Export to export the information in a data table to a PDF file.

- View and/or download the file.
Click any column heading to sort the column in ascending ![]() or descending
or descending ![]() order, then click the column heading again to reverse the order.
order, then click the column heading again to reverse the order.
Tip:
If the information in a data table displays over a number of pages, use the page navigation located in the bottom right-hand corner of a page. You can go to the next and previous pages or to a specific page, as needed.
Find specific information in a data table using the Search field.
As you type the first 3 characters of your search text, the data table filters to display results based on what you have entered. The data table is further filtered as you keep typing your search text.
The more unique your search text the fewer results are displayed in the data table. This lets you find exactly what you want.
Some pages and/or reports offer extra filters where you can show all or a subset of the list. These filters are usually displayed above the data table. Click an option to filter the data table by a selection.


